Situation
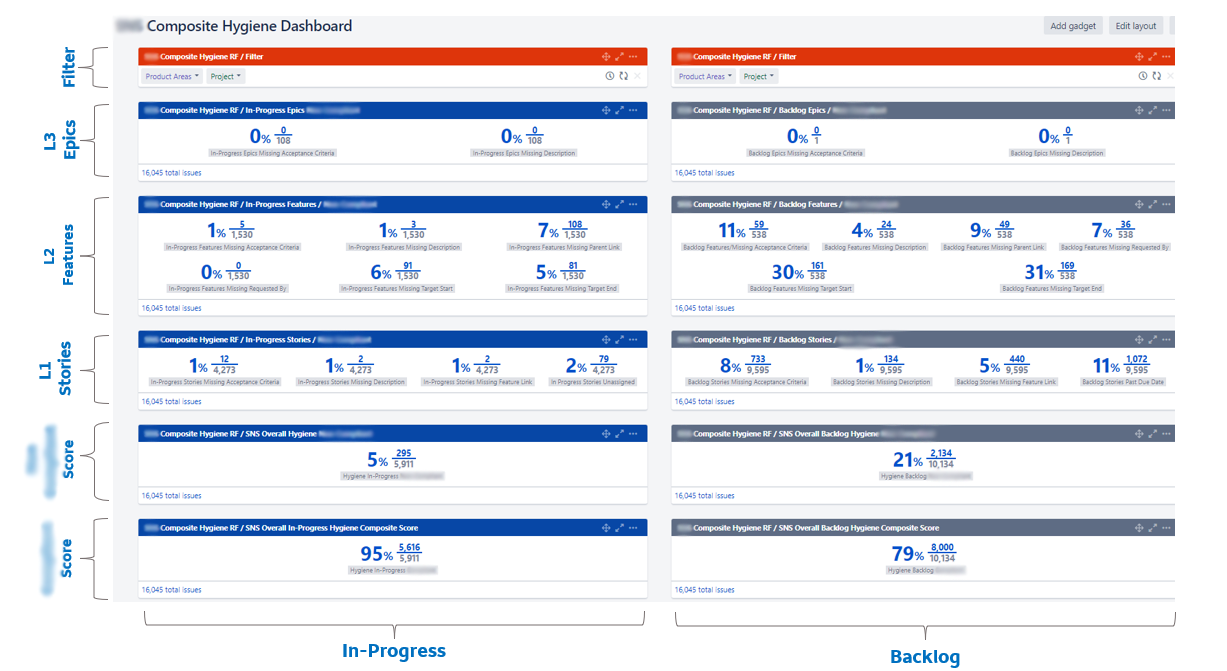
At Wells Fargo Technology, I led a team of Scrum Masters tasked with building a sophisticated Jira dashboard for Secure Network Services. The goal was to make sure every required field on a Jira issue — acceptance criteria, descriptions, target start and end dates and more — was properly completed. Given the scale of Secure Network Services, the work spanned multiple product areas and thousands of issues, so the solution had to highlight missing fields across a large number of Epics, Features and Stories in both To Do and In Progress.
The dashboard needed filters for each tower under Secure Network Services and for each Jira project, with compliant vs. non-compliant issues shown as ratios and percentages so senior leadership had a clear overview of Jira hygiene.
Challenges
We had to get the right view permissions across every project and gather the correct Jira keys from a large number of them. None of us had built dashboards or custom ratios of this complexity before, so it was a learning curve for the whole team. We also designed the architecture so other departments across Wells Fargo Technology could replicate it.
The approach & solution
We used a rich-filter approach built on SmartFilters, custom ratios and saved filters. The finished dashboard combined more than 20 custom ratios and saved filters across 8 product areas.
The results
The dashboard gave senior leadership unprecedented transparency into Jira hygiene, with a clear view of compliant and non-compliant Epics, Features and Stories. Teams could fix outstanding issues quickly, and Jira hygiene across Secure Network Services rose from around 70% to a steady 95–100%, improving efficiency and accountability across the organization.
What people said
“I had the privilege of witnessing firsthand the impact Garrick Plaisted had on our Jira hygiene and overall process efficiency. Leading a cross-functional team, he developed a highly complex, yet intuitive, Jira dashboard for Secure Network Services that addressed key pain points across multiple product areas. What stood out most was his ability to simplify a highly detailed, technical challenge, resulting in a dashboard that not only provided transparency but also empowered teams to take immediate action. The solution improved our Jira hygiene from under 70% to nearly 99%, an incredible achievement that has become a model for other areas within Wells Fargo Technology. …”
“Working alongside Garrick on the Secure Network Services Jira Composite Hygiene dashboard was an incredible learning experience. From the start, he brought clear vision and direction to a highly complex project. This was new territory for all of us — we had never built a dashboard with so many custom ratios, filters, and cross-project integrations — but Garrick guided the team with confidence and collaboration every step of the way. … Thanks to our efforts, we saw a massive improvement in our Jira compliance, jumping from below 70% to nearly 95% in my area. …”